By CoinWeek News Staff….
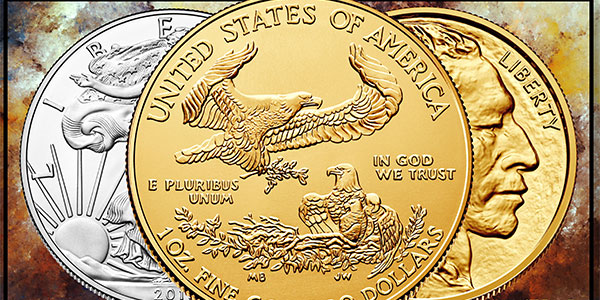
The United States Mint recently announced the final sales figures for its 2015 bullion coins. The following table compares 2015 sales in ounces with those of 2014, as released by the U.S. Treasury Department’s Office of Corporate Communications on December 31, 2015 and amended on January 4:
Regarding Percent Difference, green denotes an increase in sales over the previous year while red denotes a decrease or downward adjustment.
| Program | 2014 | 2015 | Percent Difference |
| America the Beautiful 5 oz. Silver: | |||
|
667,500 | 1,063,000 | +59.25% |
| American Buffalo Gold: | |||
|
177,500 | 220,500 | +24.22% |
| American Eagle Gold: | |||
|
415,500 | 626,500 | +50.78% |
|
23,000 | 37,500 | +63.04% |
|
29,500 | 39,500 | +33.89% |
|
56,500 | 98,000 | +73.45% |
|
524,500 | 801,500 | +52.81% |
| American Eagle Silver: | |||
|
44,006,000 | 47,000,000 | +6.80% |
Sales of the 2015 American Eagle 1 oz silver bullion coin hit record levels for the third year in a row, with 47,000,000 one-ounce coins sold during its 2015 production run. The previous record, 2014’s total of 44,006,000 ounces sold, represented a 3.12% increase over the 2013 sales total of 42,675,000.
CoinWeek’s first State of the Mint weekly U.S. Mint coin sales report of the new year, scheduled for publication on Wednesday, January 6, will further analyze this and other trends.


